Home / Benchmarking / Water
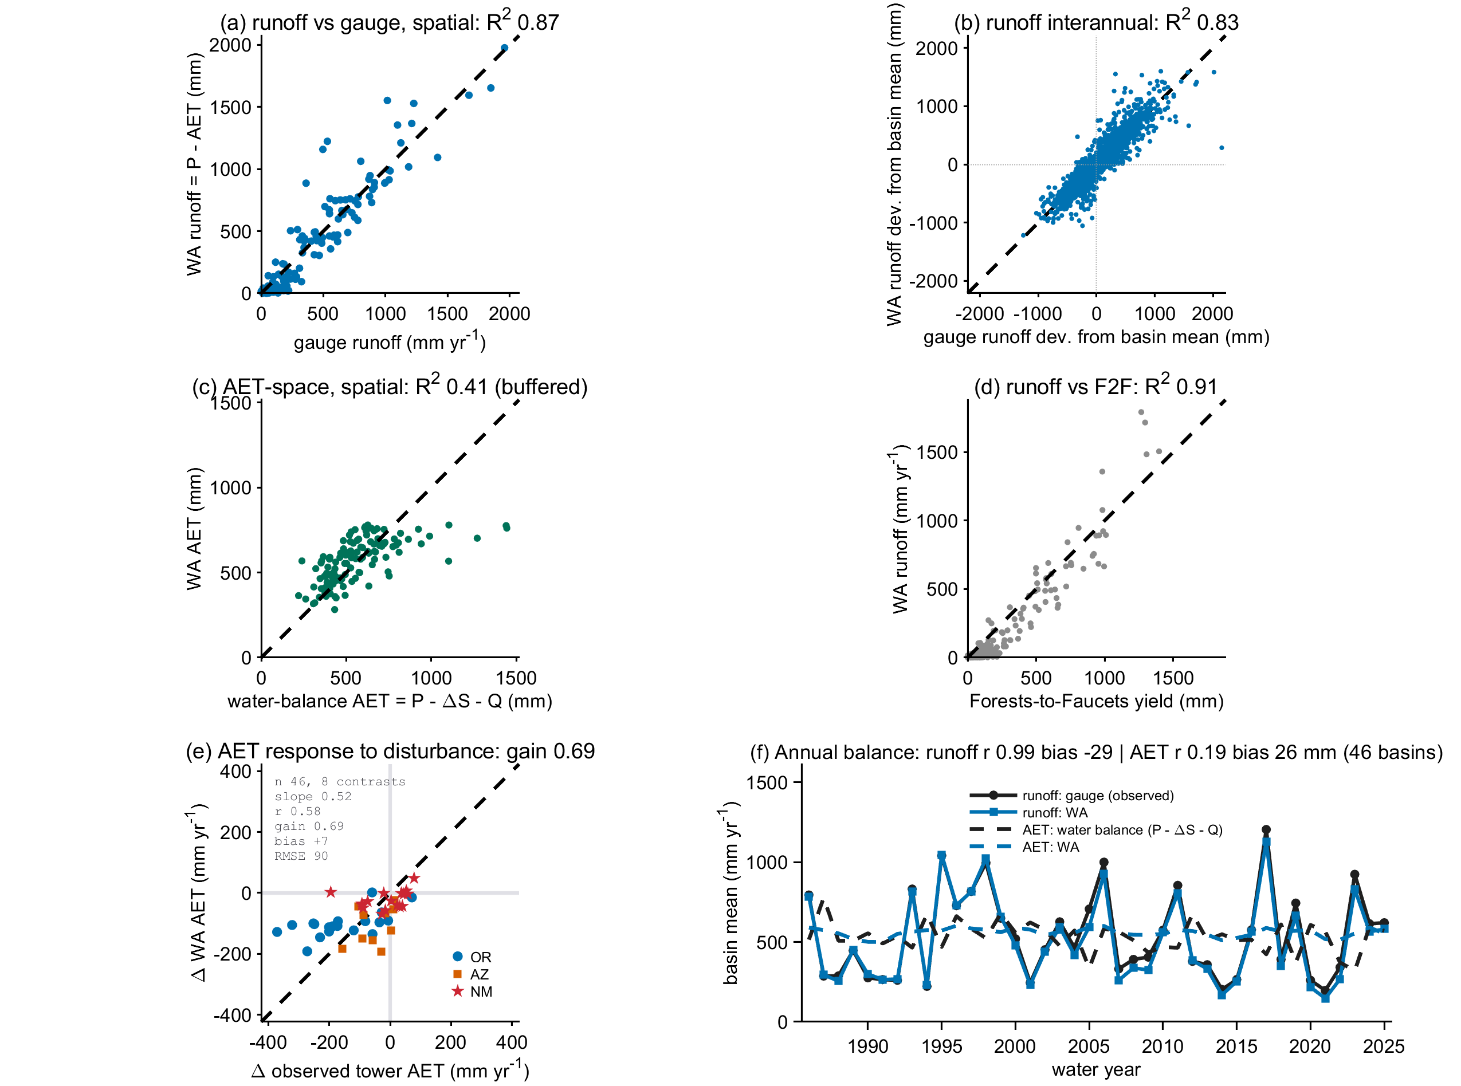
The strongest external test in the dataset: runoff matches 122 gauged basins in both space and time, and AET holds steady beneath a five-fold runoff swing.
a WA runoff against 122 gauged basins, basin by basin. Close match across the state (R² 0.87, slope 1.01).
b The same with each basin's own average removed, so only wet-year against dry-year differences remain. WA still tracks the gauges (R² 0.83).
c WA evapotranspiration against what the water balance requires - precipitation minus streamflow and storage change. Right level and slope; scatter is wide because AET itself varies little.
d WA runoff against the USFS Forests-to-Faucets water-yield product. Close agreement (slope 1.02, R² 0.91).
e Change in evapotranspiration after disturbance at paired eddy-covariance flux towers, observed against WA. Direction right, about two-thirds of the size.
f Year by year across 46 basins: observed and WA runoff (solid) and two estimates of AET (dashed). Runoff tracks almost exactly, while AET stays flat beneath a five-fold swing in runoff.
Strengths and weaknesses on each axis, as measured. Weaknesses are stated at the same level of detail as strengths.
| Axis | Strengths | Weaknesses |
|---|---|---|
| External skill | Runoff matches gauges in space (R² 0.87, slope 1.01) [a] and in time (interannual deviation R² 0.83) [b], and reproduces the observed wet/dry sequence year by year (r 0.99, bias -29 mm) [f]. WA AET is consistent with independent water-balance AET from precipitation minus gauged runoff [c]. Across disturbed flux-tower pairs, WA AET tracks the measured change [e]: 46 contrast-years, 8 paired stands, bias 7 mm, RMSE 90 mm, NDVI elasticity 0.40 against 0.41 observed. | The disturbance test rests on a sparse and noisy dataset [e], and WA may underestimate the AET change with disturbance (gain 0.69). No basin-scale disturbance-response test exists. Panel c hints at saturation at higher AET and possible underestimation in the wettest basins. Fine spatial detail and AET interannual amplitude remain buffered. These analyses are butting up against the limits of what benchmarking data exist. |
| Internal coherence | WA AET holds steady beneath a runoff signal that swings five-fold [f] - interannual variance in runoff is driven mainly by precipitation, not AET. The never-disturbed cohort agrees: AET buffered to about 0.05x the precipitation amplitude, seam-free over 40 years. | The never-disturbed cohort shows interannual variability with drought that is likely real, which precludes the full stability analysis done for the other properties. |
| Cross-dataset consistency | Close agreement between WA runoff and USFS Forests-to-Faucets: slope 1.02, R² 0.91 [d]. | Both axes of that comparison are strongly driven by precipitation, traceable to a common lineage, and F2F is coarse-resolution. The runoff comparisons generally (a, b, d, and runoff in f) are weaker evidence than they superficially appear for the same reason; the AET comparisons (c, e, AET in f) subtract that effect out and are the stronger evaluation. |
WA runoff is precipitation minus WA AET. References: 122 gauged basins (USGS NWIS and CDEC full natural flow); USFS Forests-to-Faucets 2.0 water yield; AmeriFlux eddy-covariance towers. A variety of alternative water-balance products were also tested; most compared poorly against each other, and it was difficult to identify strong datasets for intercomparison.