Home / Benchmarking / Fire: burn probability

Fire: burn probability

Ranks where fire occurs well above chance across four decades - but an annually-updated FSim product beats it on every overlapping year.

Layer Fire_ELMFire_BurnProbabilityRelative 3 evidence axes v2026.1

What was compared

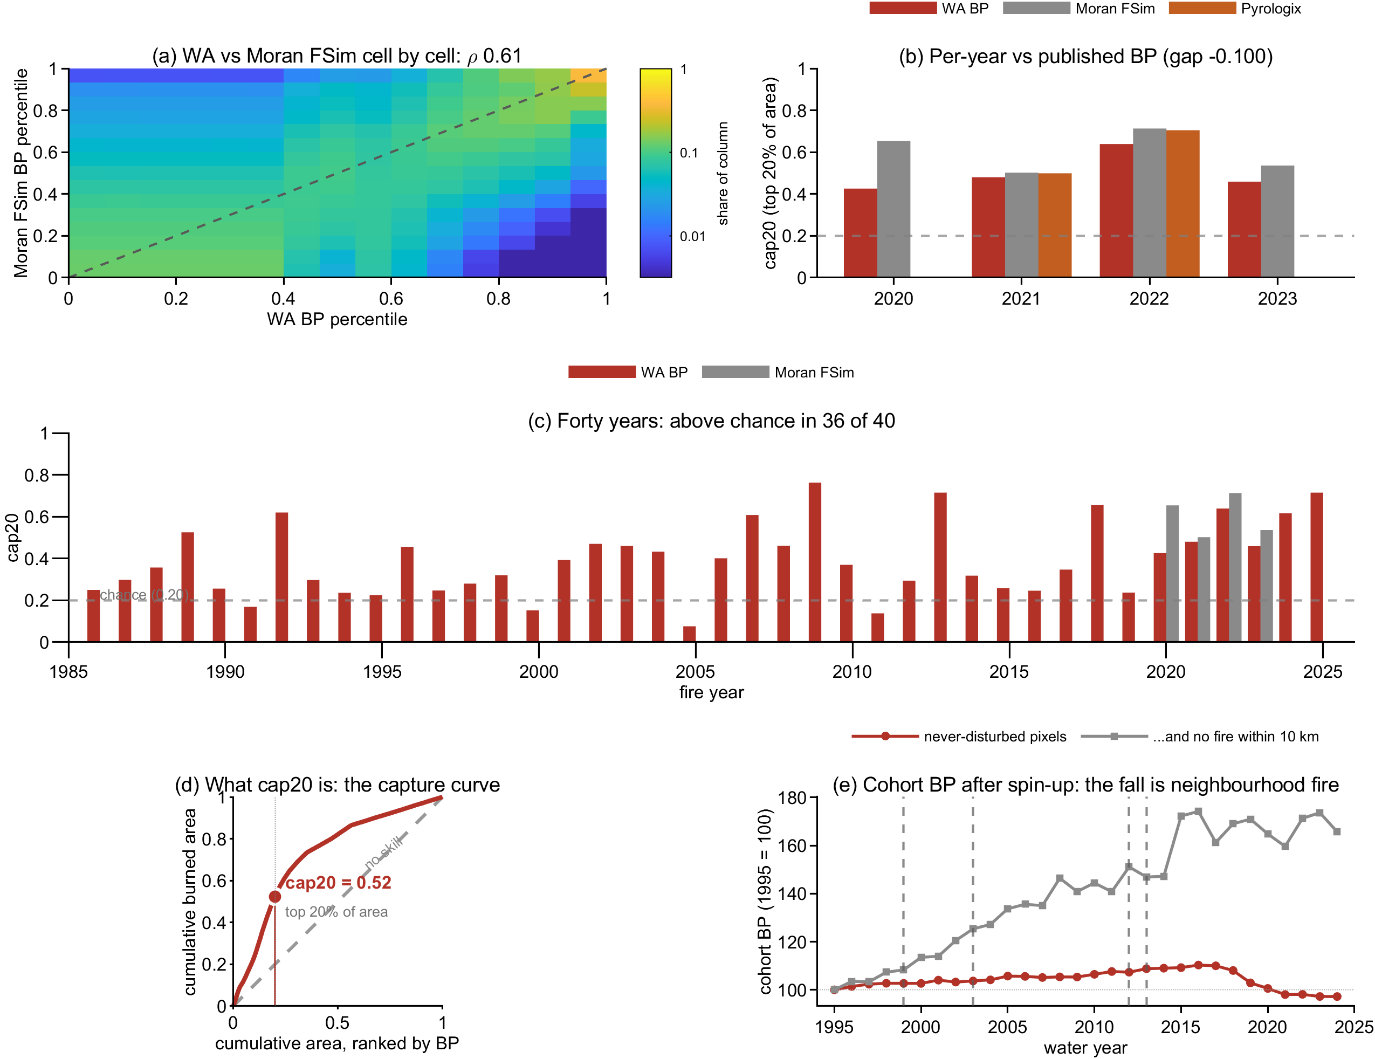
Fire: burn probability benchmarking figure: multi-panel comparison of Wildland Almanac against reference data.
Benchmarking panels for fire: burn probability, from WildlandAlmanac_CA_QualityBenchmarks.pdf (v2026.1). Panel letters below correspond to the panels above.

a  WA against the published Moran burn probability, cell by cell across California.

b  Year by year against Moran and Pyrologix on the same test, so the three are scored identically.

c  Forty years: the share of burned area falling in the top 20% of predicted burn probability. Above chance (0.20) in nearly every year.

d  What that score means - the cumulative capture curve, showing how much fire is caught as more of the landscape is included.

e  Two never-disturbed cohorts from 1995: all such pixels and only those with no fire within 10 km. The isolated set rises as fuel accumulates; the other falls because neighbouring fire removes fuel.

Evidence

Strengths and weaknesses on each axis, as measured. Weaknesses are stated at the same level of detail as strengths.

AxisStrengthsWeaknesses
External skillA clear relationship between predicted burn probability and subsequent fire, with cap20 of 0.52 [d]. BP ranks where fire occurs well above chance in the recent, fully independent years (0.582 across five, all above the 0.20 floor), and holds across the 40-year record with only modest degradation back to the 1980s [c] - likely driven by consistently lower burn occurrence, since fewer fires make prediction noisier.—
Internal coherenceUndisturbed-cohort BP rises systematically for pixels with no fire within a 10 km buffer, reflecting fuel build-up [e]. Landsat transitions are clean. Pixels with nearby fire show no such rise, then an abrupt decrease coincident with the large statewide increase in burning - BP is tracking neighbourhood fire, as it should.—
Cross-dataset consistencyGeneral agreement with Moran and Pyrologix on relative BP within identical cells [a]; the two maps agree cell by cell (Spearman 0.61 against Moran). Scores against subsequent burn occurrence are broadly consistent with both in most years [b].Moran's annually-updated FSim BP beats WA on all four overlapping years, with an especially large gap in the high-fire year 2020 (-0.100). Panel a is rank-only: WA is not calibrated to absolute BP the way Moran and Pyrologix are, so comparisons of level or slope are not possible.
Synthesis.
High confidence  Maps burn probability across the landscape and tracks elevated risk for four decades

Lower confidence  Moran and Pyrologix predict subsequent burning better; WA is not calibrated to absolute probability

Specifics

WA burn probability is a conditional climatology, not a forecast. References: Moran et al. 2025 annual burn probability (OSF z6gnt, 2020-2023); Pyrologix; observed burned area from MTBS and FRAP perimeters.