Home / Benchmarking / Disturbance
Finds and dates fire - 92% of high-severity area, 92% within a year - but under-registers diffuse and partial disturbance.
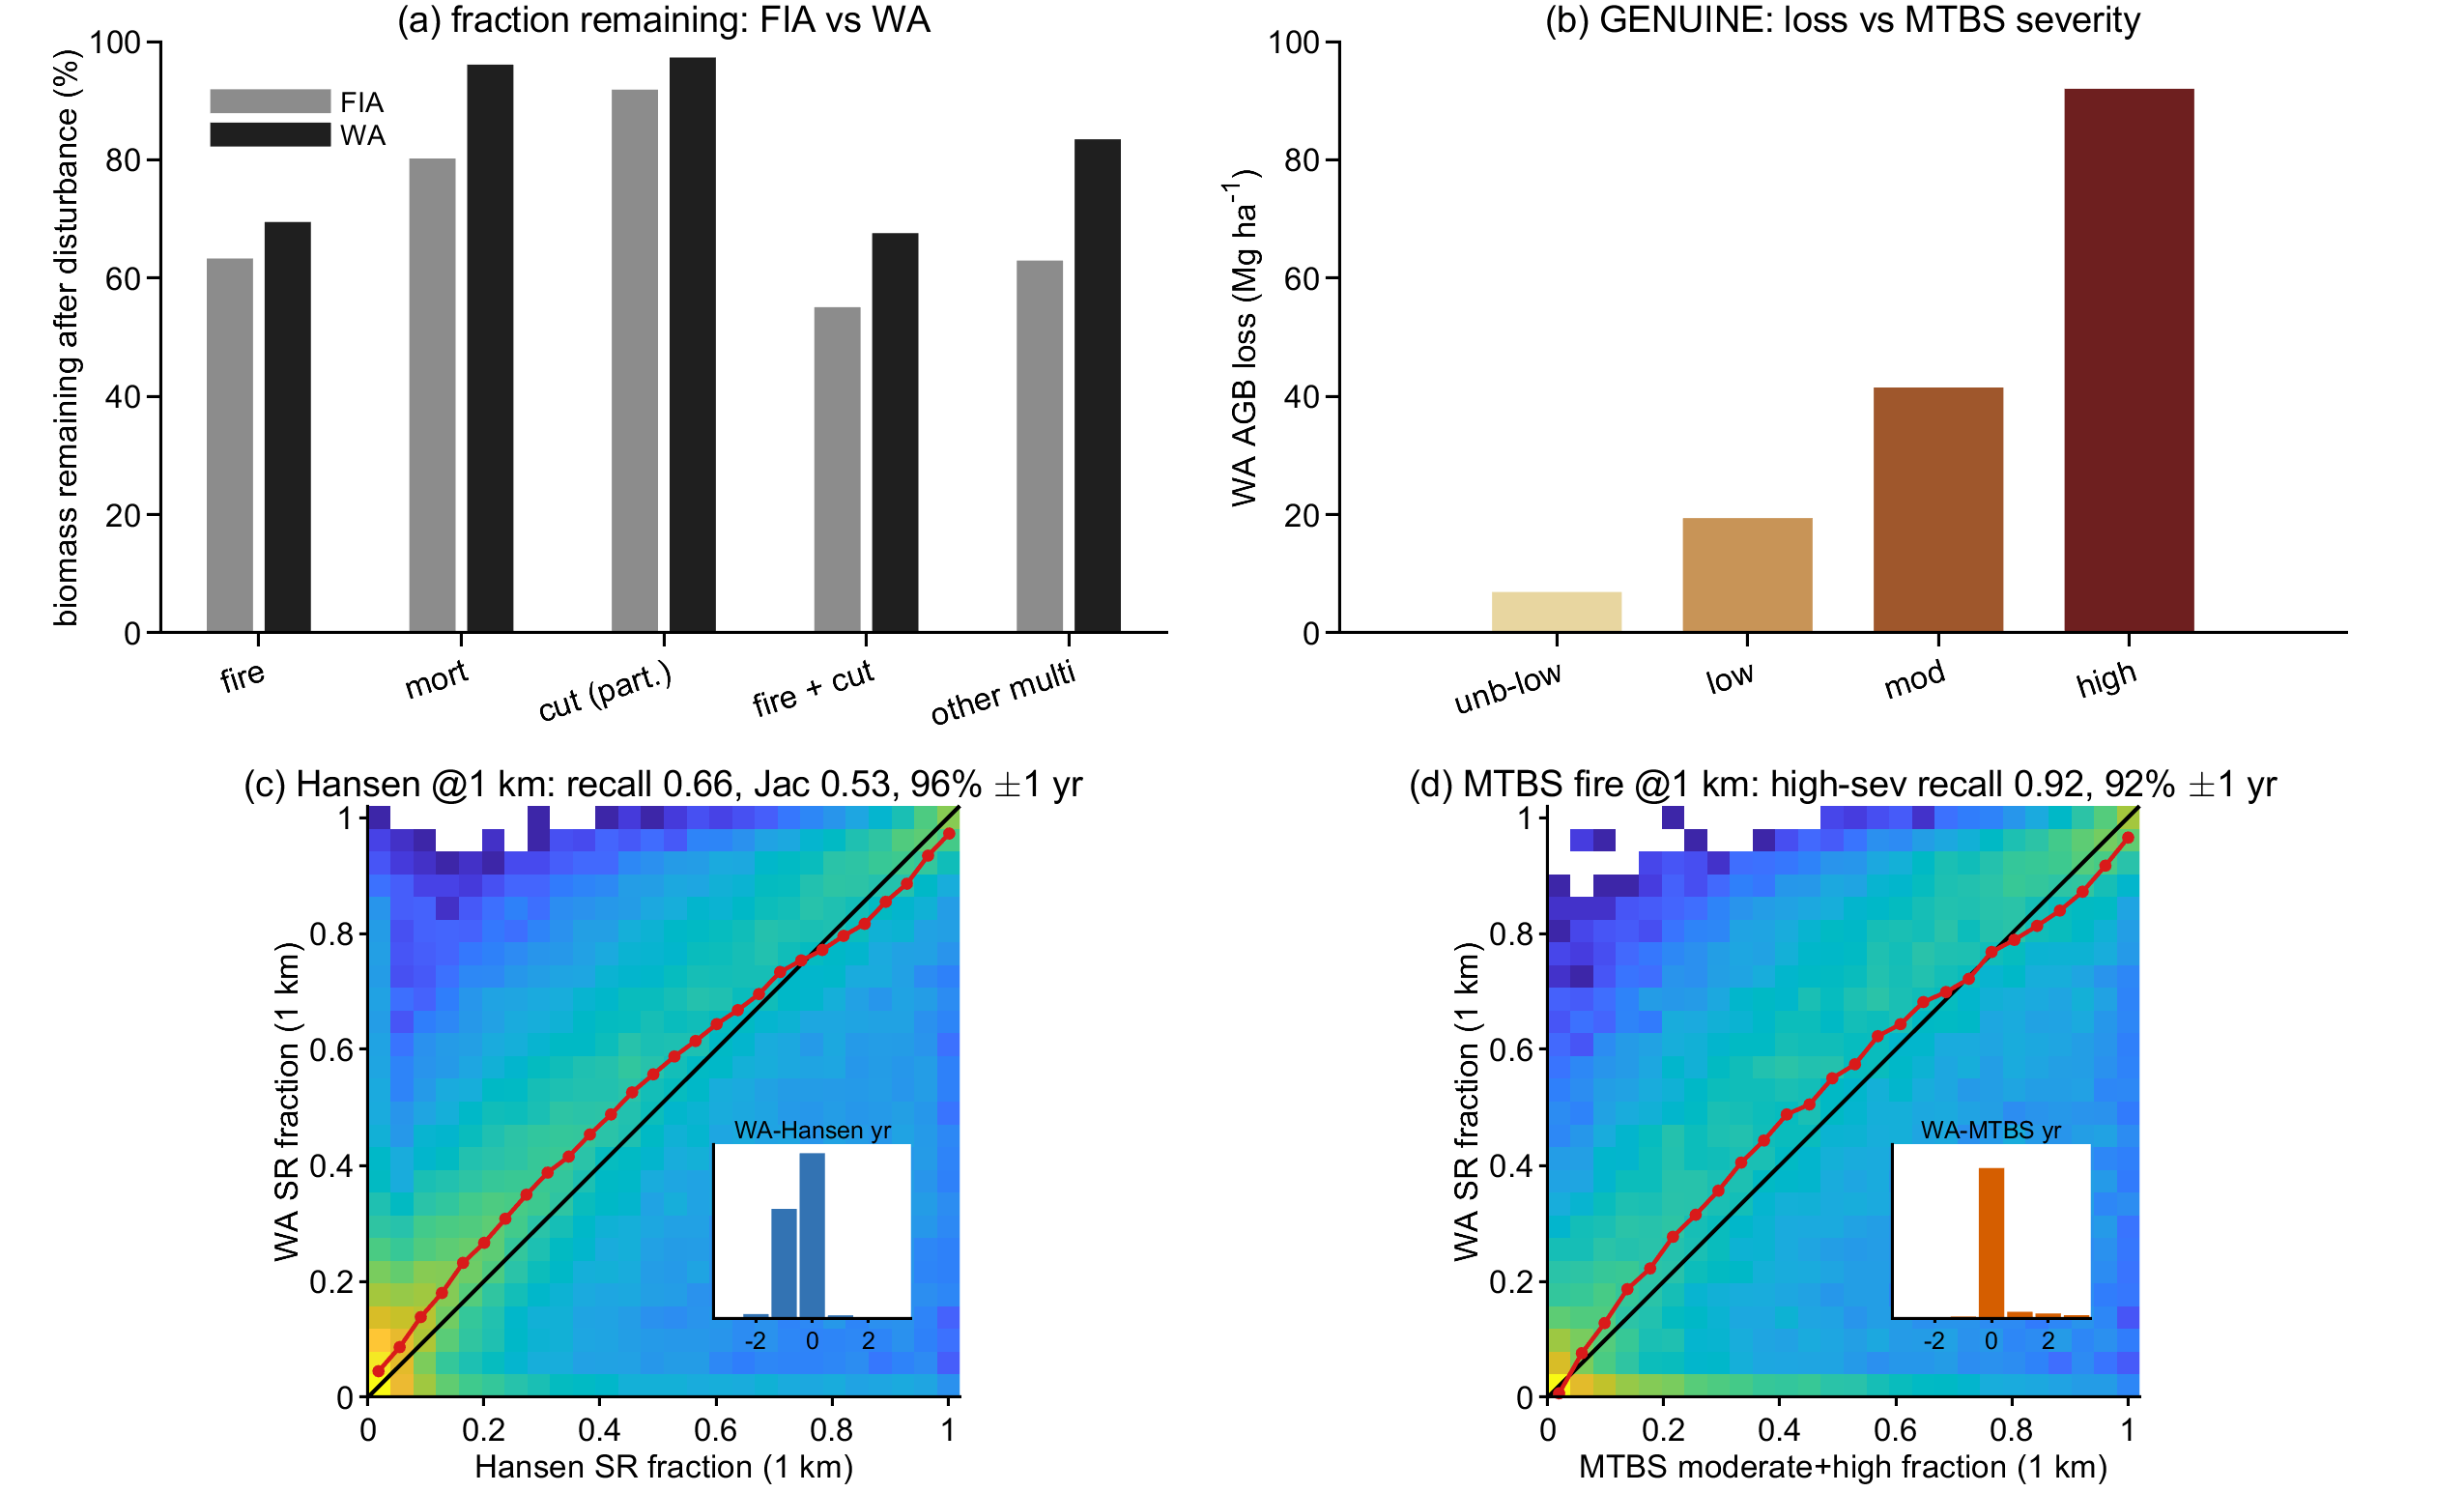
a Biomass remaining after disturbance, WA against FIA field plots, by cause. Good agreement after fire; most insect, disease and drought loss is missed.
b WA biomass loss against independent MTBS fire severity. Loss climbs steeply, from 7 Mg/ha in the lightest class to 92 in the heaviest.
c Where WA and Hansen both see forest loss, pooled to 1 km. WA finds 66% of Hansen's loss, and 96% of shared detections agree on the year within one.
d The same against MTBS fire. WA finds 92% of high-severity fire and 81% of moderate, and dates 92% of it within one year.
Strengths and weaknesses on each axis, as measured. Weaknesses are stated at the same level of detail as strengths.
| Axis | Strengths | Weaknesses |
|---|---|---|
| External skill | FIA field: WA tracks how much biomass each agent removes, with fire capture 0.66 [a]. Loss rises monotonically with independent MTBS severity, 7 to 92 Mg/ha [b]. Severe fire drives post-fire AGB toward zero (10% below 25 Mg/ha). | Non-fire magnitude is soft: mortality capture 0.15, harvest 0.28 - diffuse and partial disturbance is under-registered [a]. The detection floor misses small and low-severity events. |
| Internal coherence | Closure holds: large AGB drops coincide with the disturbance flag, and only 2% of pixel-years are big drops with no flag. WA correctly identifies fire as the dominant agent. | That 2% is diffuse mortality the abrupt-change detector misses. The layer targets abrupt loss, not gradual decline - by design, but it bounds what it can be used for. |
| Cross-dataset consistency | At 1 km, WA maps and dates fire with no bias (median on the 1:1): high-severity recall 92%, Jaccard 0.58, 92% within ±1 yr against MTBS [d]. Hansen agrees on stand replacement (Jaccard 0.53, 96% within ±1 yr) [c]. | MTBS and Hansen share Landsat lineage with WA, so this is consistency rather than proof - though they are independently produced, which makes agreement on where and when meaningful. Per-cell fraction density scatters (R² 0.55) where WA biomass and MTBS dNBR draw intensity differently. |
WA = Disturbance, 1986-2024. References: Hansen/UMD Global Forest Change v1.12 (annual loss 2001-2024); MTBS thematic severity 1984-2024; FIA repeat-visit plots (FIADB California, 2024 release).