Home / Benchmarking / Drought dieoff

Drought dieoff

Locates dieoff through a super-additive height x deficit interaction, and leads aerial survey by about a year - but it is a screening layer, not a per-pixel count.

Layer Vulner_TreeDieoff_* 3 evidence axes v2026.1

What was compared

Drought dieoff benchmarking figure: multi-panel comparison of Wildland Almanac against reference data.
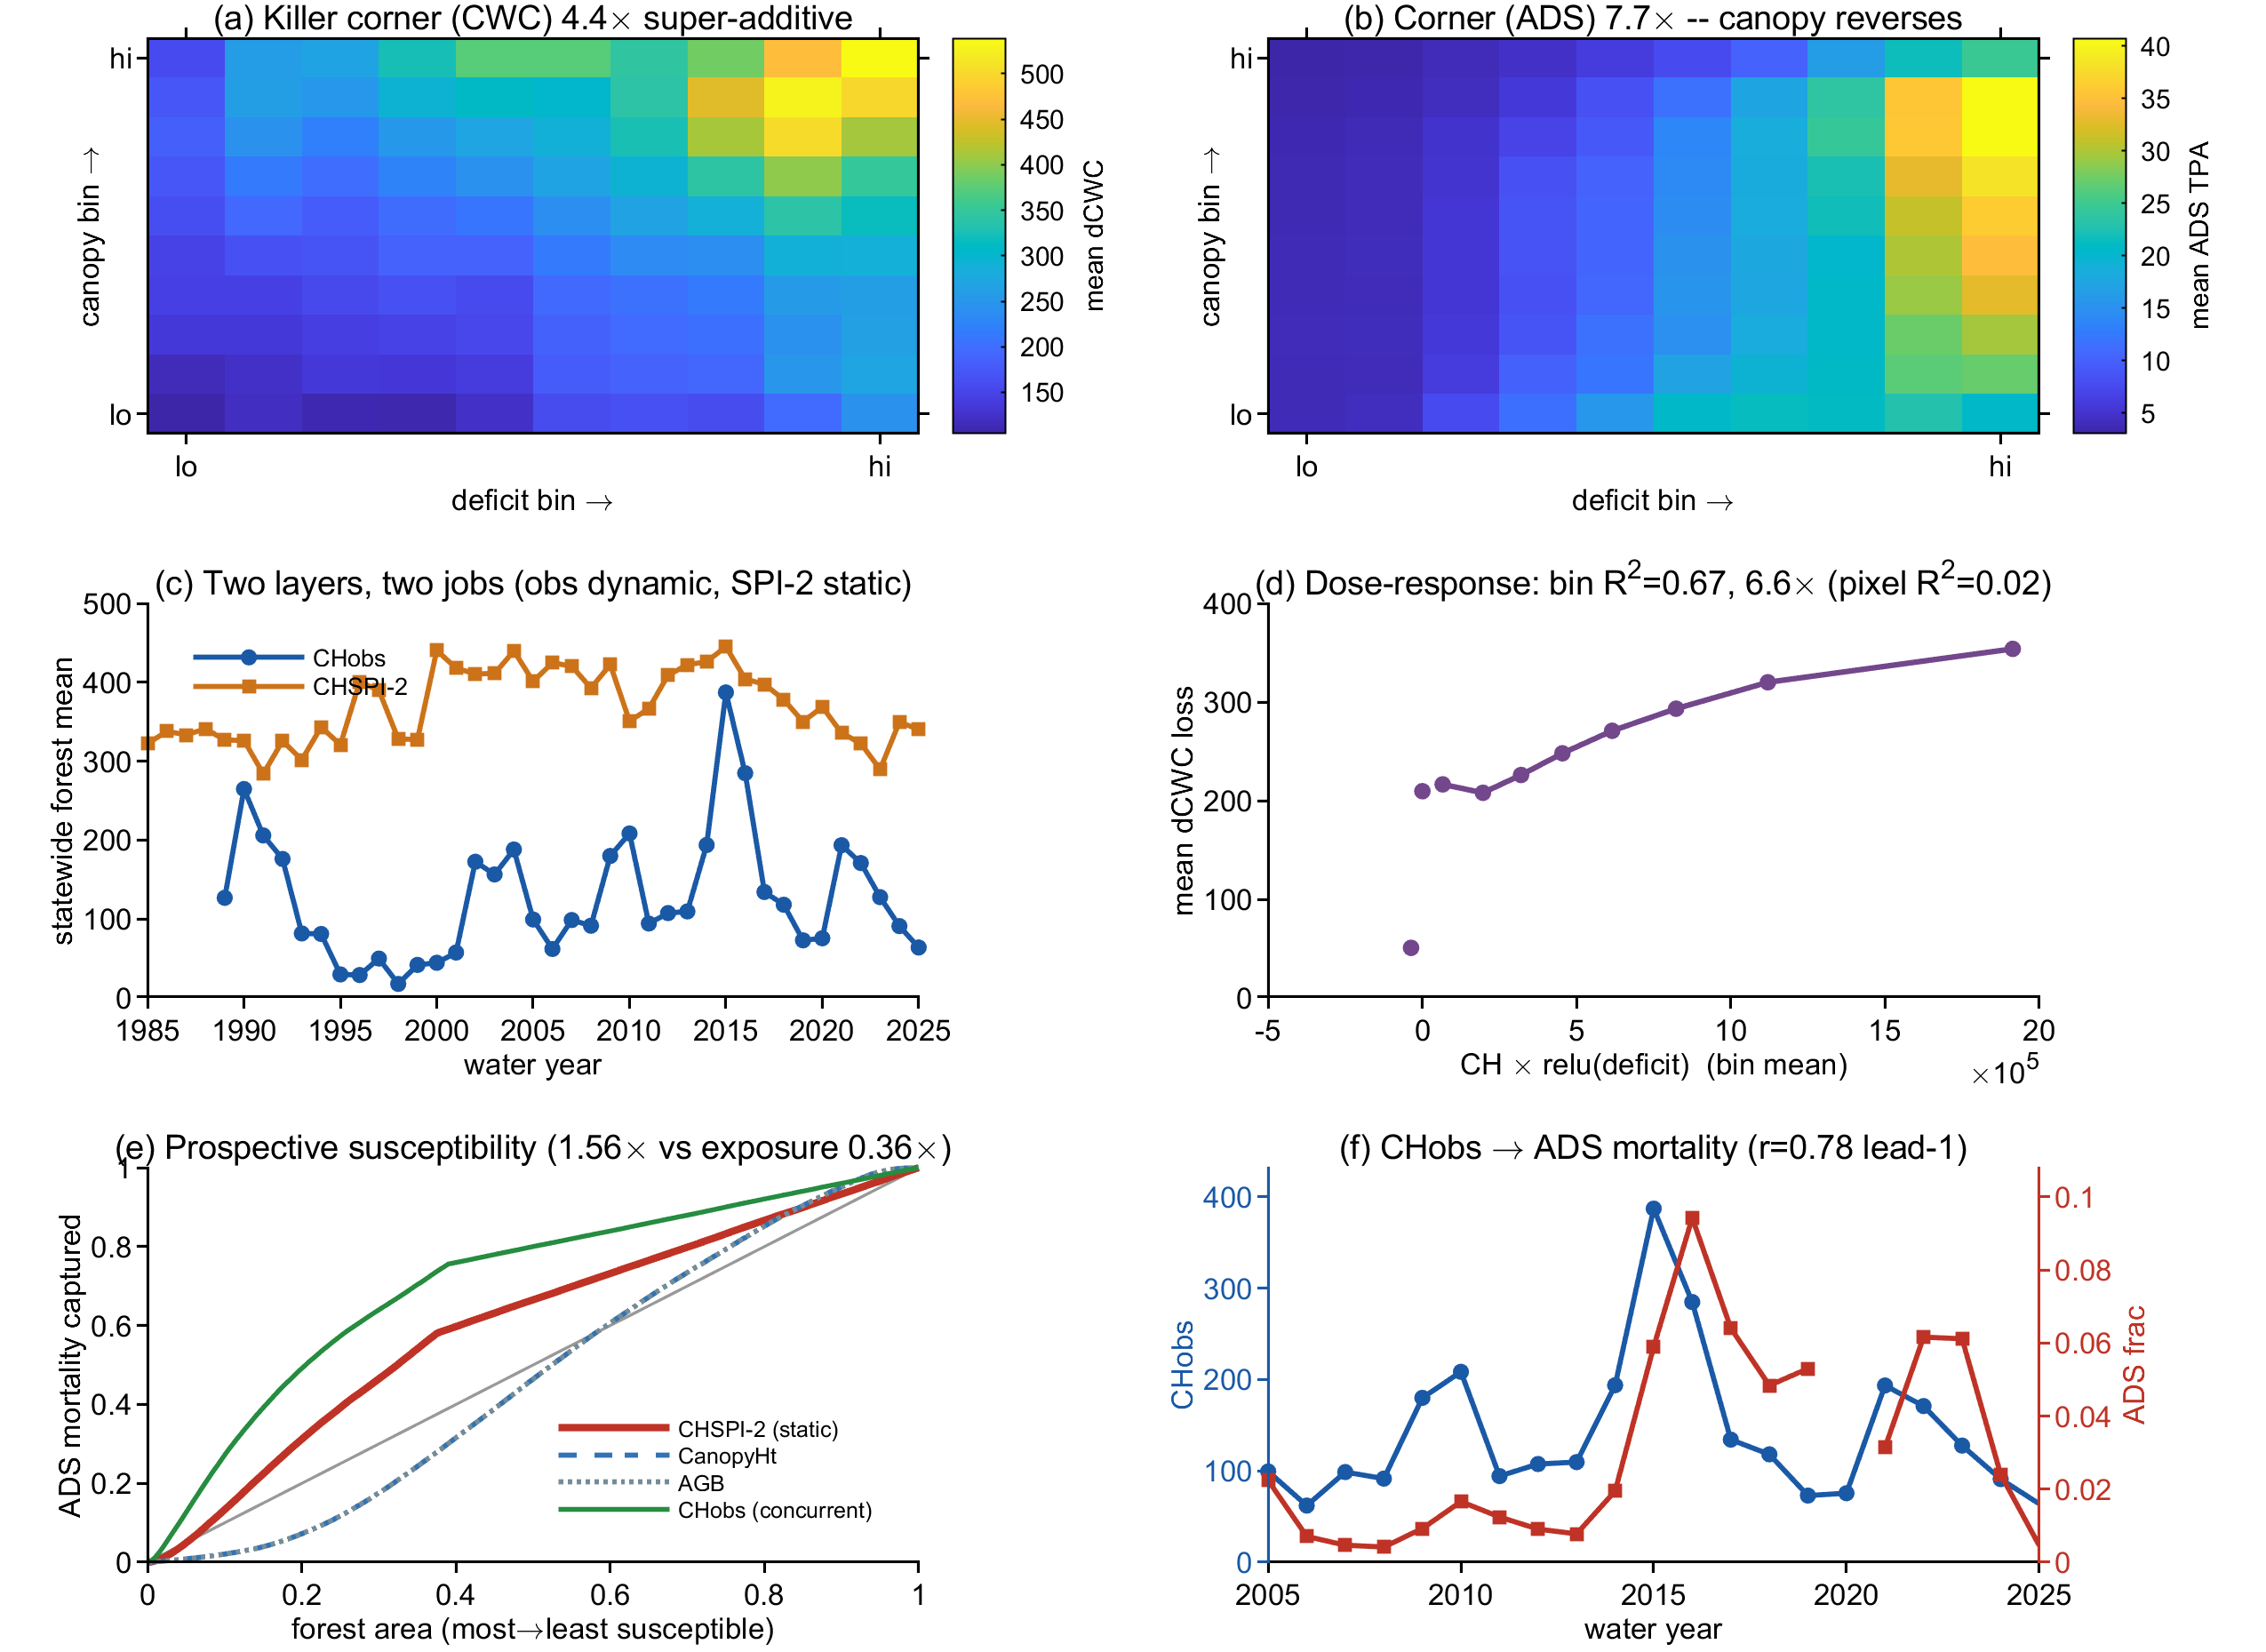
Benchmarking panels for drought dieoff, from WildlandAlmanac_CA_QualityBenchmarks.pdf (v2026.1). Panel letters below correspond to the panels above.

a  Canopy water loss split by canopy height and by drought. Where both are extreme the loss is 4.4x what the two effects added separately would predict.

b  The same corner measured by aerial-survey mortality: 3.7 trees per acre where neither is extreme against 27 where both are, a 7.7-fold difference. The canopy axis reverses in this currency.

c  The two dieoff layers side by side. One tracks year-to-year change, the other is a static susceptibility map; they do different jobs.

d  Predicted vulnerability against observed canopy water loss, binned to the scale a manager would use: a clean 6.6-fold dose-response.

e  Can the map anticipate dieoff? The susceptibility layer captures more of the eventual mortality than exposure to drought alone.

f  WA canopy-height loss against aerial-survey mortality over time. WA leads the survey by about a year (r 0.78), and the lead survives detrending.

Evidence

Strengths and weaknesses on each axis, as measured. Weaknesses are stated at the same level of detail as strengths.

AxisStrengthsWeaknesses
External skillObserved canopy height leads ADS drought-and-beetle mortality by one year (r 0.78), and the lead survives first-differencing [f]. Independently, canopy water loss rises with the same hazard, both in the corner test and as a dose-response [a, d].Pixel R² is small (~0.02). This is a drought-conditioned screening layer, not a per-pixel mortality counter - report capture and dose-response, not per-pixel severity.
Internal coherenceThe killer corner is super-additive: dieoff needs both tall canopy and severe deficit, and is monotone in both axes (4.4x in canopy water content) [a]. Deficit is the invariant driver - the canopy axis reverses currency on ADS stems [b].Scope is a single drought epicentre in a single state (2012-16 southern Sierra). Generalisation to CONUS and to other droughts is future work.
Cross-dataset consistencyClean decision-scale dose-response, 6.6x top-to-bottom decile [d]. The static susceptibility layer beats plain drought exposure prospectively, 1.56x against 0.36x [e]. The dynamic and static layers do genuinely distinct jobs [c].Absolute severity and totals are unresolved - the layer sets the odds, not per-pixel counts. ADS is itself a lower bound on scattered mortality.
Synthesis.
High confidence  Height x multi-year deficit interaction locates dieoff

Lower confidence  Per-pixel severity and absolute totals

Specifics

Both references are independent of WA: USFS aerial detection survey mortality (CA BIOS ds2783, survey years 2015-2017 summed) and Brodrick/Asner canopy water content, 2014-2017.