Home / Benchmarking / Aboveground biomass

Aboveground biomass

Tracks FIA to about 200 Mg/ha then saturates; agrees closely with GEDI lidar; misses diffuse mortality.

Layer Carbon_AGB 3 evidence axes v2026.1

What was compared

Aboveground biomass benchmarking figure: multi-panel comparison of Wildland Almanac against reference data.
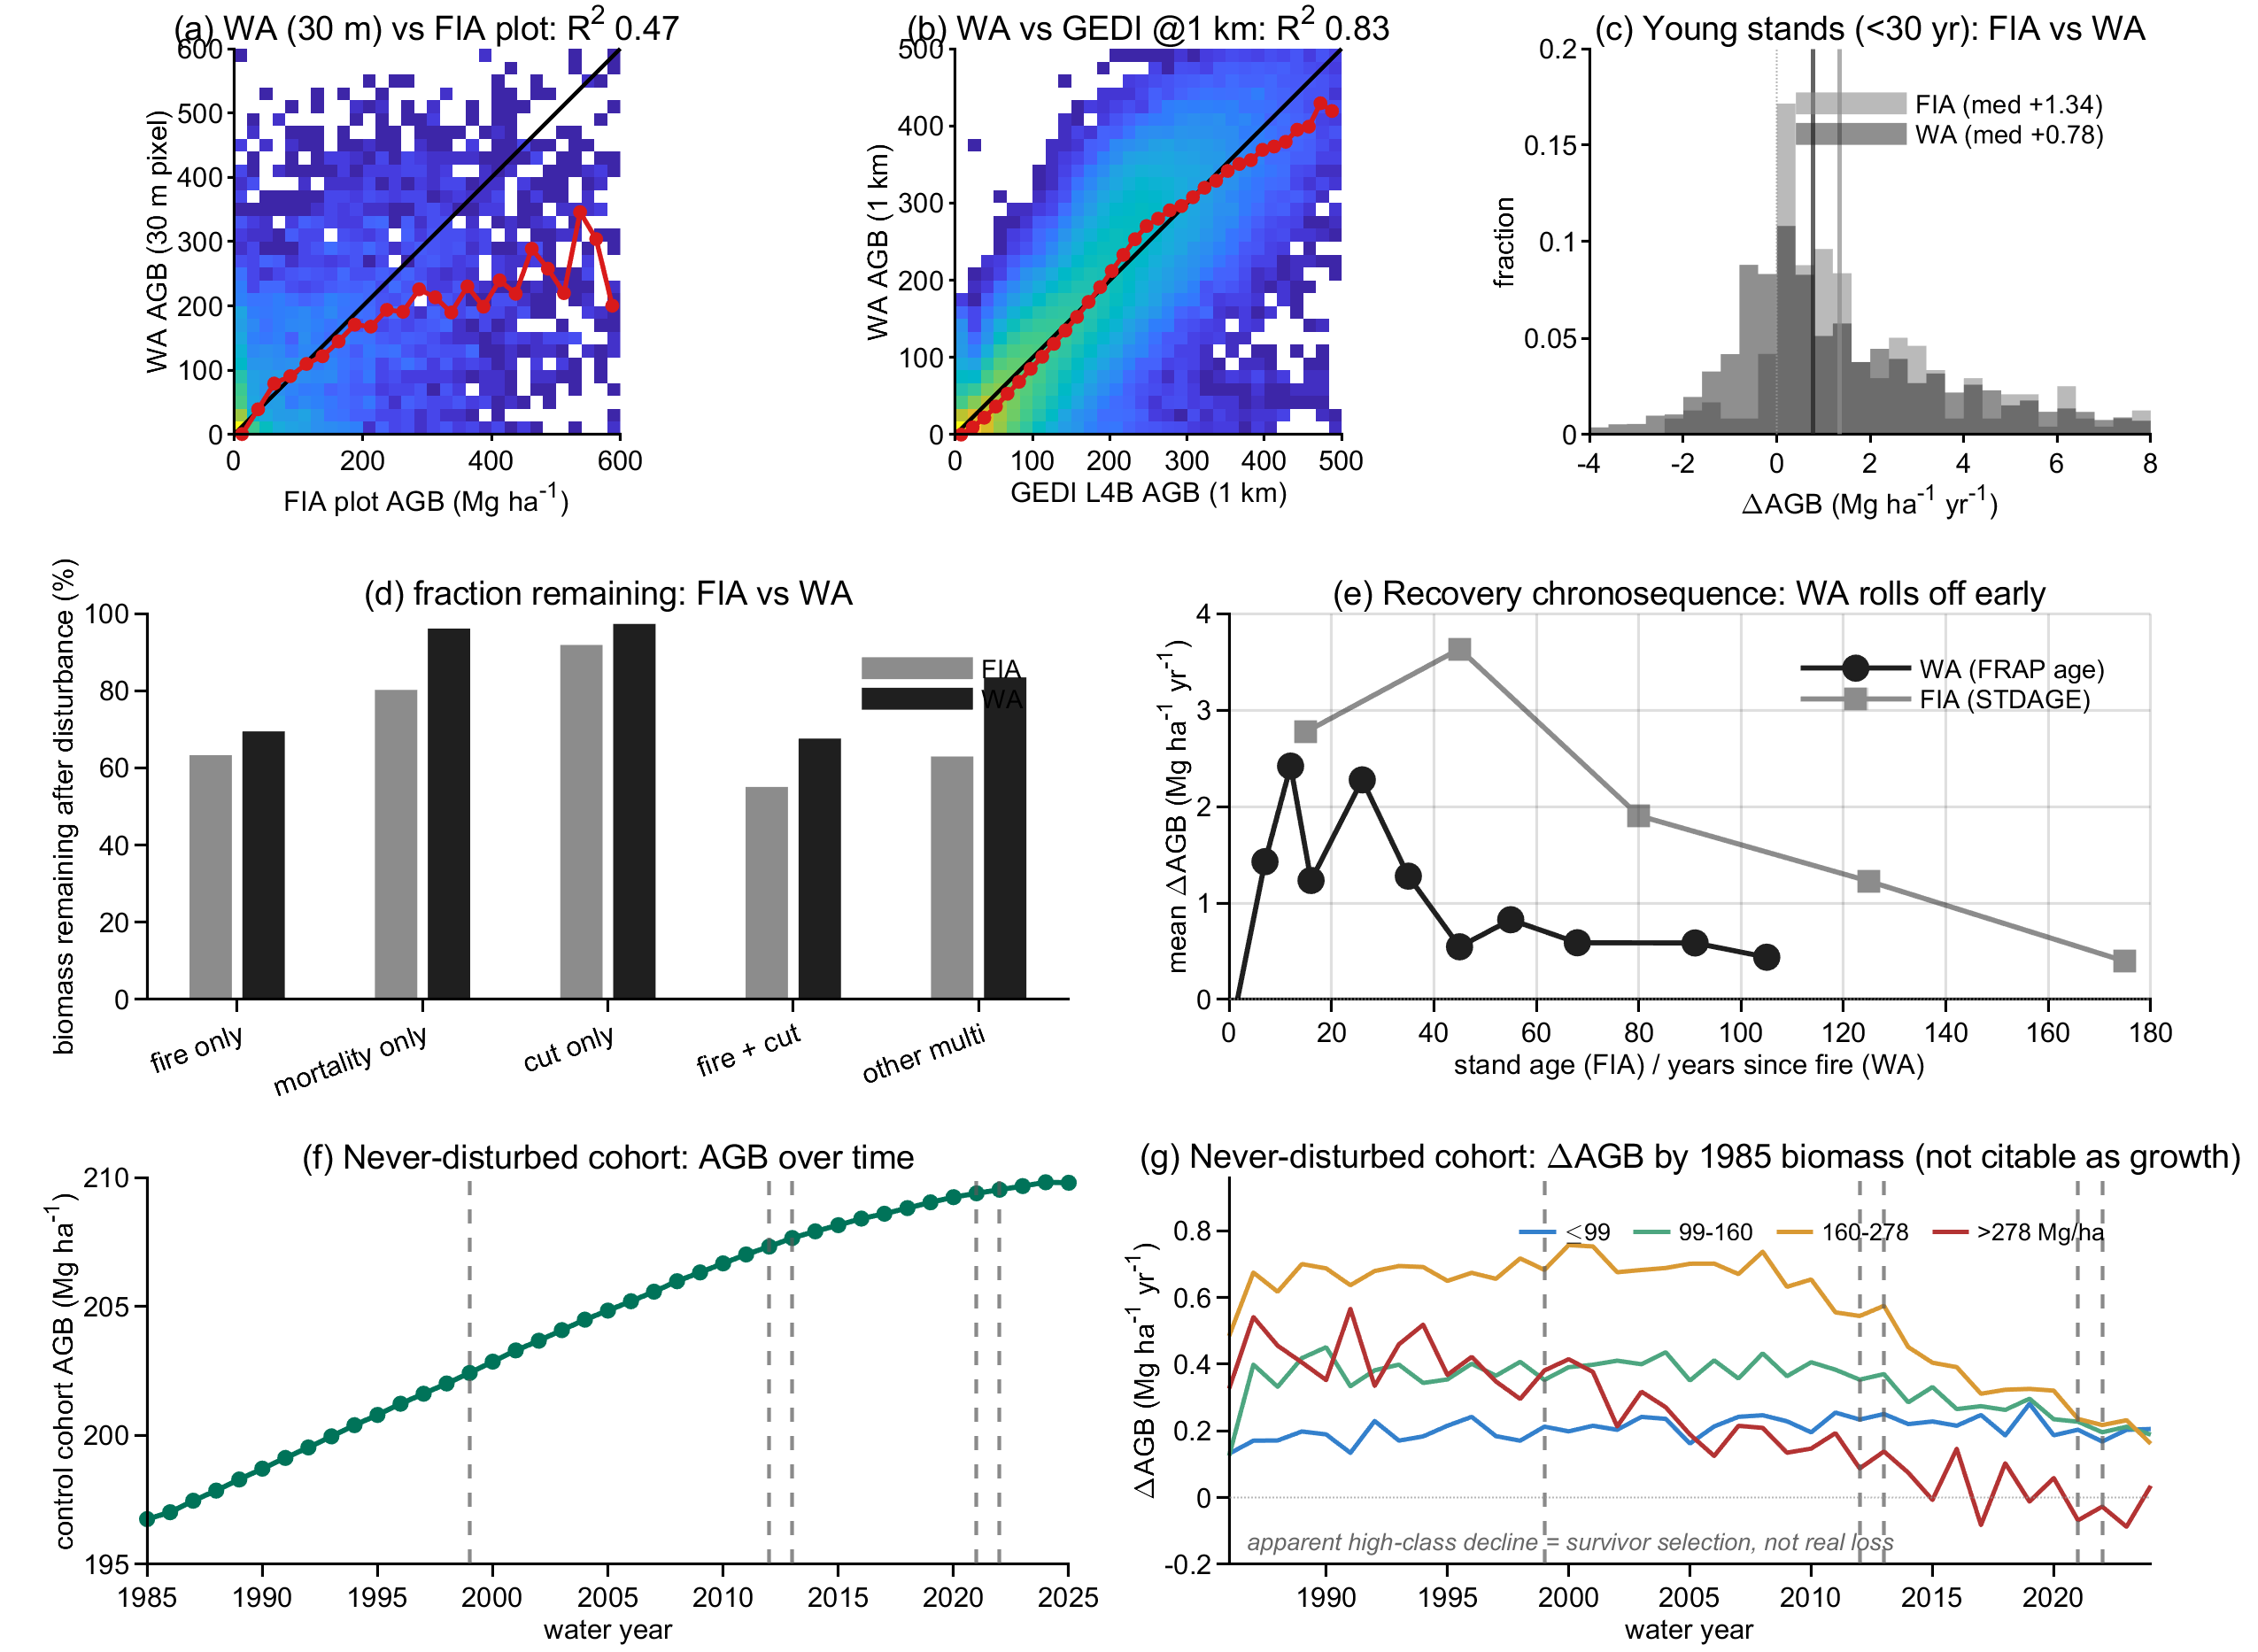
Benchmarking panels for aboveground biomass, from WildlandAlmanac_CA_QualityBenchmarks.pdf (v2026.1). Panel letters below correspond to the panels above.

a  WA biomass against 13,395 FIA field plots, one 30 m pixel per plot, 2013-2023. WA tracks FIA to ~200 Mg/ha, then saturates.

b  WA 2020 against GEDI lidar on GEDI's 1 km grid. Close agreement (slope 0.98, R² 0.83), so WA's biomass level is not an artefact of averaging.

c  Yearly biomass gain in stands under 30 years old, WA against repeat-visit FIA plots. Similar spread and shape; median WA about 40% low.

d  Biomass remaining after disturbance, by cause. WA matches FIA after fire, but misses most loss from insects, disease and drought.

e  Biomass gain against stand age. The two agree for the first 30 years; after that WA is low by up to 80%.

f  Average WA biomass 1985-2025 for forest never disturbed. Smooth and steady, with no jumps where the Landsat satellites changed over.

g  The same never-disturbed forest split by 1985 starting biomass. Classes separate sensibly, though rates likely underestimate true growth due to saturation.

Evidence

Strengths and weaknesses on each axis, as measured. Weaknesses are stated at the same level of detail as strengths.

AxisStrengthsWeaknesses
External skillWA AGB reproduces the FIA pattern (R² 0.90 at 50 km) and holds at native 30 m: R² 0.47 against fuzzed FIA, near the ceiling that FIA fuzzing and plot noise allow [a]. Accumulation rates in young (<30 yr) stands match FIA in magnitude and distribution [c, e]. Disturbance loss magnitudes reproduce FIA repeat observations [d].WA significantly underestimates AGB loss from diffuse mortality [d]. It underestimates growth rate in mid to older stands from about 40 yr [e], and underestimates AGB in stands above ~200 Mg/ha [a]. These last two are consistent: saturation likely leads to underestimated increment in larger or older forests, with implications for regional accumulation accounting.
Internal coherenceThe never-disturbed cohort is temporally stable with steady monotonic growth, and shows no discontinuities or seams at Landsat sensor changeovers [f]. Trends within it follow trajectories consistent with forestry and ecosystem dynamics, rolling off with age and AGB [g].Some of that smoothness and roll-off may itself reflect the inability of WA - and other optical AGB datasets - to detect modest change in stands that are already large, whether from optical saturation or from allometric decoupling between AGB and canopy height.
Cross-dataset consistencyGood agreement with GEDI L4B at 1 km: slope 0.98, R² 0.83. Agreement is not an averaging artefact, and GEDI is a lidar peer of independent lineage [b].That very similarity implies much of the saturation may have an allometric source rather than an optical one, since GEDI should be immune to optical saturation.
Synthesis.
High confidence  Magnitude of AGB; rate of growth in young stands; abrupt disturbance loss

Lower confidence  Diffuse mortality and closed-canopy growth

Specifics

WA = Carbon_AGB. References: FIA field plots (FIADB California, 2024 release; measured 2013-2023); GEDI L4B v2.1 gridded biomass at 1 km, covering 2019-04 to 2021-08, compared against WA 2020.